The Brainstem Imaging Lab aims to develop in living humans a neuroimaging-based atlas and connectivity diagram of brainstem nuclei by the use of dedicated MRI pulse sequences and scanners. Our ultimate goal is to enhance our knowledge and the quality of patient care in a vast array of brainstem-related disorders, such as disorders of consciousness, sleep disorders, vestibular disorders, autonomic dysfunction, and movement disorders (such as Parkinson’s disease).
BRAINSTEM NAVIGATOR RELEASE!
Check our publicly released Brainstem Navigator toolkit v0.9, which includes the brainstem atlas and brainstem MRI templates in living humans!
You have a 3 Tesla or 7 Tesla MRI scanner, and you wonder where tiny raphe nuclei or other brainstem nuclei are in your images? You could consider using our recently released Brainstem Navigator toolkit, which currently includes in vivo probabilistic atlas of brainstem nuclei and brainstem MRI templates. Upon downloading the Brainstem Navigator, you will be able to locate several brainstem and diencephalic nuclei (see list below) in your images by precisely aligning your MRIs to stereotaxic (IIT or MNI) space (i.e. the brainstem atlas space).
Interested in further developing this tool? We are HIRING, please contact us!
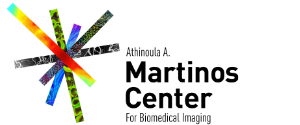
Brainstem Nuclei Atlas
A) 3D rendering of the structural atlas labels of the first nine delineated brainstem nuclei (Bianciardi et al., 2015). B) Example delineation (Bianciardi et al., 2018) of the left (blue) and right (red-yellow) pedunculotegmental (PTg, also called pedunculopontine) nucleus and pontine reticular formation oral part (PnO, also called pontis oralis). The PTg and PnO are islands of hypointensity in the diffusion fractional anisotropy (FA) and the T2weighted (T2w) 7 Tesla image, respectively. In C)-F) we show the atlas labels of additional brainstem nuclei (Garcia-Gomar et al., 2019; 2021; Singh et al., 2019; 2021). For the brainstem nuclei atas labels we performed in vivo validation (internal consistency and intra-rater agreement), and for some nuclei, also ex vivo validation (i.e. histology) as in D.
We developed an in vivo 7 Tesla multi-contrast procedure able to segment on a single-subject basis 31 brainstem nuclei and 3 diencephalic nuclei crucial for arousal, autonomic and sensory-motor functions. Further, we created a probabilistic structural atlas of these nuclei in stereotaxic (MNI) space by computing the spatial overlap across subjects of the single-subject nuclei segmentations (Bianciardi et al., Brain Connect 2015; Bianciardi et al., Neuroimage 2018, Garcia-Gomar et al., Frontiers Neurosci 2019, Movement Disorders 2021; Singh et al., Frontiers Neurosci 2020; Brain Connectivity 2021, see Figure above). Out atlas can be used in conventional (e.g. 3 Tesla) research and clinical MRI studies to investigate brainstem mechanisms in health and brainstem-related disorders. We are currently expanding the atlas to include additional brainstem nuclei by the use of sub-millimiter spatial resolution and additional image contrasts.
List of delineated brainstem nuclei:
1) Substantia Nigra 1/2 (compatible with pars reticulata/compacta); 2) Red Nucleus subregion 1/2;
3) Inferior Olivary Nucleus; 4) Raphe Magnus;
5) Dorsal Raphe; 6) Median Raphe;
7) Paramedian Raphe; 8) Caudal-rostral Linear Raphe;
9) Periaqueductal Gray; 10) Pedunculotegmental (also called pedunculopontine) nucleus;
11) Cuneiform nucleus; 12) Pontine Reticular Formation oral-caudal part (“points oralis-caudalis”);
13) Inferior Colliculus; 14) Superior Colliculus;
15) Superior olivary complex; 16) Vestibular nuclei complex;
17) Lateral parabrachial nucleus; 18) Medial parabrachial nucleus;
19) Medullary Viscero-Sensory-Motor Nuclei Complex; 20) Microcellular tegmental nucleus
21) Mesencephalic reticular formation; 22) Isthmic reticular formation;
23) Ventral tegmental area; 24) Leterodorsal tegmental nucleus;
25) Locus coeruleus; 26) Subcoeruleus;
27) Raphe obscurus; 28) Raphe pallidus;
29) Superior medullary reticular formation; 30) Inferior medullary reticular formation, lat/med;
31) Parvicellular Reticular nucleus alpha-part.
List of delineated diencephalic nuclei:
1) Subthalamic Nucleus subregion 1/2; 2) Lateral Geniculate nucleus;
3) Medial Geniculate nucleus.
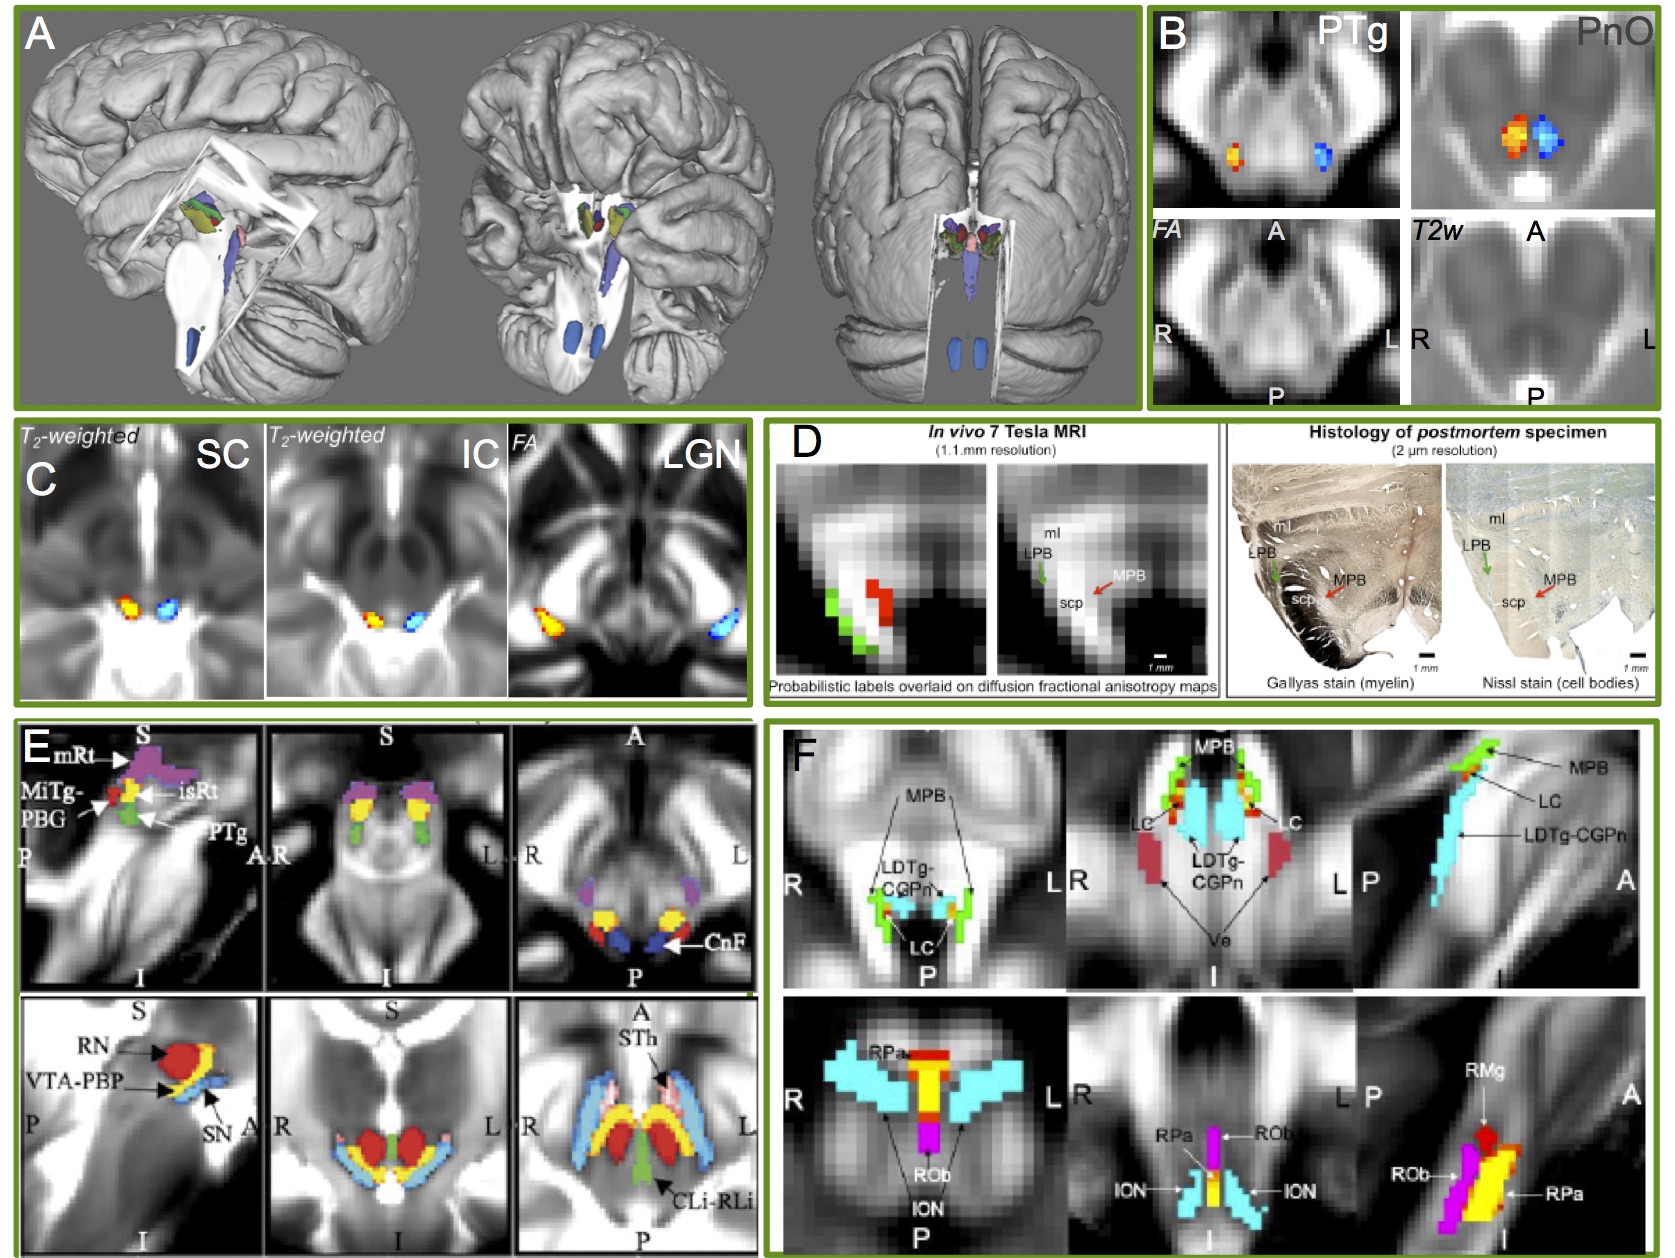
Brainstem Nuclei Connectome
A. Functional and structural connectivity matrix of 18 arousal and motor brainstem nuclei with the rest of the brain achieved (n = 20 healthy adults) after precisely mapping our probabilistic brainstem nuclei atlas to 1.1 mm spatial isotropic resting state fMRI and 1.7 mm spatial isotropic HARDI, respectively, at 7 Tesla in 20 healthy subjects. After preprocessing, to compute the fMRI connectivity, we measured the Pearson linear correlation of fMRI timecourses with the seed-average timecourse; to compute the structural connectivity, we performed seed-target streamline filtering after spherical deconvolution-based tractography (MRtrix). B. Connectivity results for an example arousal nucleus (locus coeruleus).
Imaging of the connectivity pathways of brainstem nuclei in living humans is an underserved area of human brain imaging research. Most of our knowledge about brainstem pathways derives from tracing and MRI studies in animals and ex vivo humans.
To fill this gap, we are evaluating the functional and structural connectivity of brainstem nuclei with the rest of the brain. To do so, we exploit the increased sensitivity, spatial resolution and contrast of 7 Tesla MRI scanners to acquire cutting edge resting state functional MRI and diffusion based MRI. After mapping our brainstem nuclei atlas to single-subject MRI data (via precise image coregistration), we are able to build connectivity diagrams (connectomes) of brainstem nuclei with target cortical and subcortical regions (Bianciardi et al., MAGMA 2016; Singh et al., under review, Cauzzo et al., under review, Garcia-Gomar et al., under review; see Figure above). To aid the interpretation of these connectomes, we are also building prediction models of brainstem networks (Satpute et al., Neurosci Lett 2018), which include the nodes and pathways expected from previous animal and ex vivo human studies.
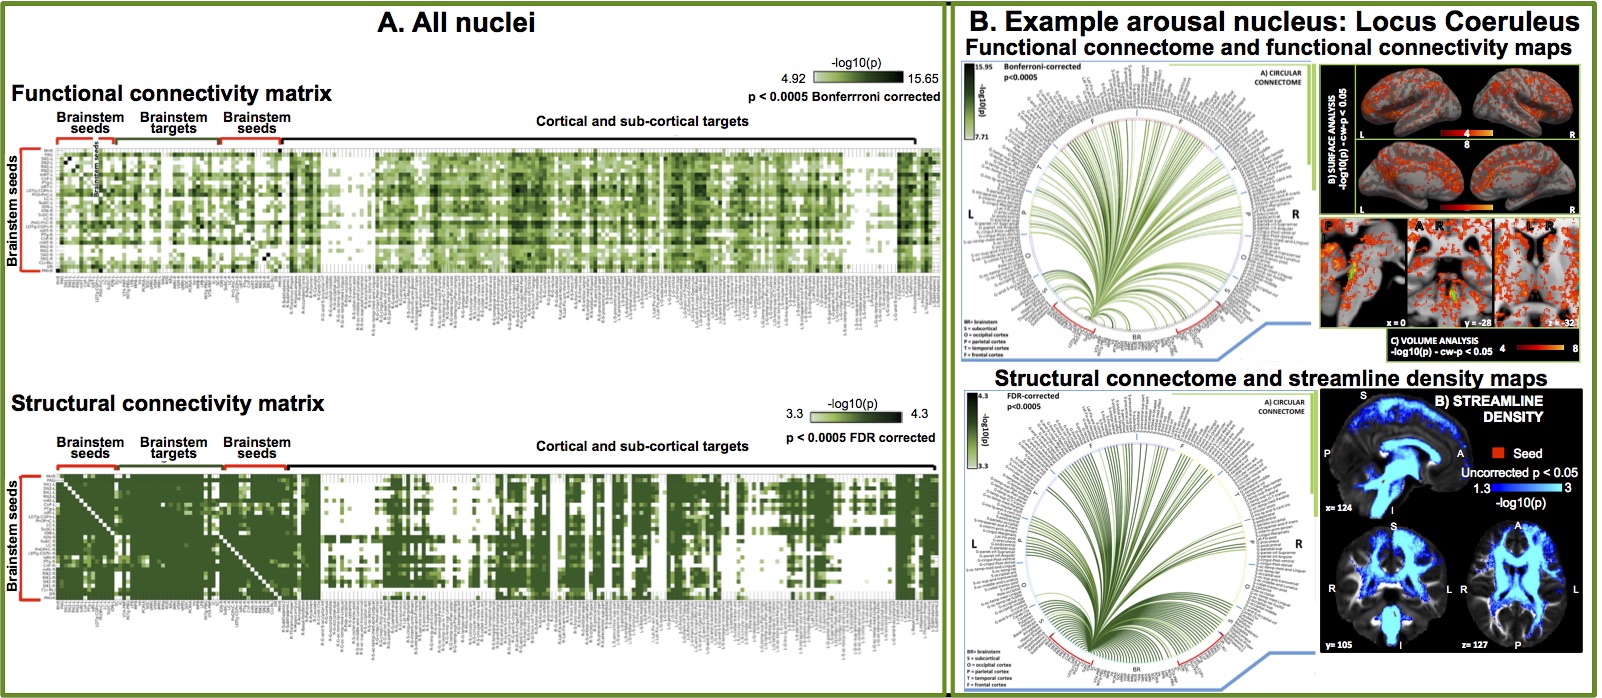
Brainstem Mechanisms in Health and Disease
Proof-of-concept clinical use of our brainstem nuclei atlas is demonstrated by mapping the atlas to: Left) 3 Tesla susceptibility weighted images of a traumatic coma patients, and Right) REM sleep behavior disorder (RBD) patients (i.e. a prodromal model of Parkinson’s disease). Left) Evaluation of microbleeds in 3 Tesla SWI of traumatic coma patients (n = 12) in the acute phase. Microbleeds were mainly present in the thalamus and in the upper brainstem, i.e. midbrain and pons. No single arousal brainstem nucleus was affected by microbleeeds across the whole cohort; rather a combination of microbleeds in multiple brainstem nuclei were compatible with coma pathogenesis and recovery of consciousness within 6 months. Interestingly, brainstem arousal nuclei were partially affected by microbleeds. Moreover, compared to microbleed volume within non-arousal brainstem regions, the microbleed volume within arousal brainstem nuclei accounted for a larger proportion of variance in coma outcome scores. Right) Evaluation of structural connectivity in RBD patients by 7 Tesla HARDI demonstrated impaired structural connectivity in several brainstem nuclei, including the connectivity between REM-on (e.g. subcoeruleus) and REM-sleep muscle-atonia (e.g. medullary reticular formation) areas. The brainstem nuclei diagram of impaired connectivity in human RBD expands animal models and is a promising tool to study and possibly assess prodromal synucleinopathy stages.
Our brainstem nuclei atlas and connectome can be applied to study brainstem mechanisms in health and in a wide array of brainstem pathologies, such as disorders of consciousness, sleep disorders, Parkinson’s and motor diseases, chronic pain, altered autonomic function, and vestibular disorders.
Our team is currently working on the translational application of the brainstem nuclei atlas and connectome to improve our understanding of arousal mechanisms in traumatic coma and its prognostication (collaboration with Dr. Edlow, MGH). We are also investigating arousal and motor mechanisms in REM-sleep behavior disorder, which is a premotor model of Parkinson’s disease, with the goal of developing prodromal (early) brainstem-based imaging biomarkers of Parkinson’s disease (collaboration with Dr. Videnovic, MGH). Our most recent efforts are devoted to map autonomic-vestibular pathways and functional interactions in healthy subjects as a baseline for future studies of vestibular disorders (collaboration with Dr. Indovina, IRCCS Santa Lucia Foundation, and Dr. Staab, Mayo Clinic).
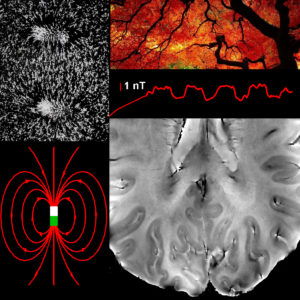
fMRI resonance frequency shifts and quantitative susceptibility changes (Bianciardi et al., 2014). During both evoked and spontaneous brain activity, local changes in blood oxygenation in pial and intra-cortical veins lead to minute changes in the magnetic susceptibility and in the MRI magnetic field in the visual cortex that could be captured directly by monitoring the MRI resonance frequency, supplementing information available from conventional fMRI methods that rely on the MRI signal amplitude changes. Top left: Picture of iron filings showing the field lines of a magnetic dipole. Bottom left: Precise mathematical representation of the field lines of a magnetic dipole. Top right: Naturalistic picture of cerebro-vascular arborization. Middle right: Time-course of the magnetic field changes (few nT) in the visual cortex during a block-design visual task that we were able to extract from 7 Tesla phase fMRI signals (Bianciardi et al., Human Brain Mapping 2014). Bottom right: High-resolution (0.31 mm in plane) 7 Tesla gradient-recalled echo phase image showing pial and intra-cortical veins in the visual cortex.
Other projects
We are also interested in developing MRI methods able to: (i) correct for physiological noise in MRI/fMRI data; (ii) extract biomarkers of brain microstructure, physiology, function and metabolism, based on multiple MRI modalities and the acquisition of physiological and electrophysiological recordings. Interestingly, our search for methods to correct for artifacts and noise (aim (i)) sometimes turned out to be an opportunity to observe interesting signals or develop novel biomarkers (aim ii)!
This was the case when we were developing methods able to remove fMRI noise related to the magnetic field changes due to respiration: once we found out how to model this type of noise from the phase fMRI signals at each time point, we were astonished to observe significant task-based and resting-state functional responses from the residual (after noise removal) phase fMRI signals (beyond the commonly employed magnitude fMRI signals). Ours was the first paper (Bianciardi et al., Human Brain Mapp 2014) reporting the measurement of task-based and resting-state fMRI resonance frequency shifts and quantitative susceptibility changes, most probably originating from neuronal activity through induced blood volume and oxygenation changes in pial and intracortical veins.
Further, our expertise in modeling and correcting for fMRI signal fluctuations due to cardiac and respiratory pulsatility effects allowed us (Bianciardi et al., Phil Trans A 2016) to develop MRI methods able to visualize MRI pulse waveforms due to pulsatility effects in several brain compartments, as well as to develop novel MRI indicators of cerebrovascular compliance (the pulsatility volume index). See the following videos!
Video_Carotids_coron_Bianciardi2016
Video_MCA_sagittalsinus_parenchyma_axial_Bianciardi2016
Video_lateral2thirdventricle_coron_Bianciardi2016
Video_lateral2thirdventricle_sagit_Bianciardi2016
Funding sources
We deeply thank our funding sources for making this work possible!
NIH NIA: R01AG063982
2019 Mind Brain Behavior Harvard Faculty Award
2017 MGH Distinguished Scholar Claflin Award
NIH NIDCD: R21-DC015888
NIH NCI: U01-CA193632
NIH NIBIB: K01-EB019474; P41-EB015896